The end is at hand. Bears, just surrender now. Since the mid-June low (where I called the S&P 500 bottom), we’ve seen the fed funds rate jump from 1.00% to 4.75%. Of course, all we’ve heard since then is what?
Don’t Fight The Fed
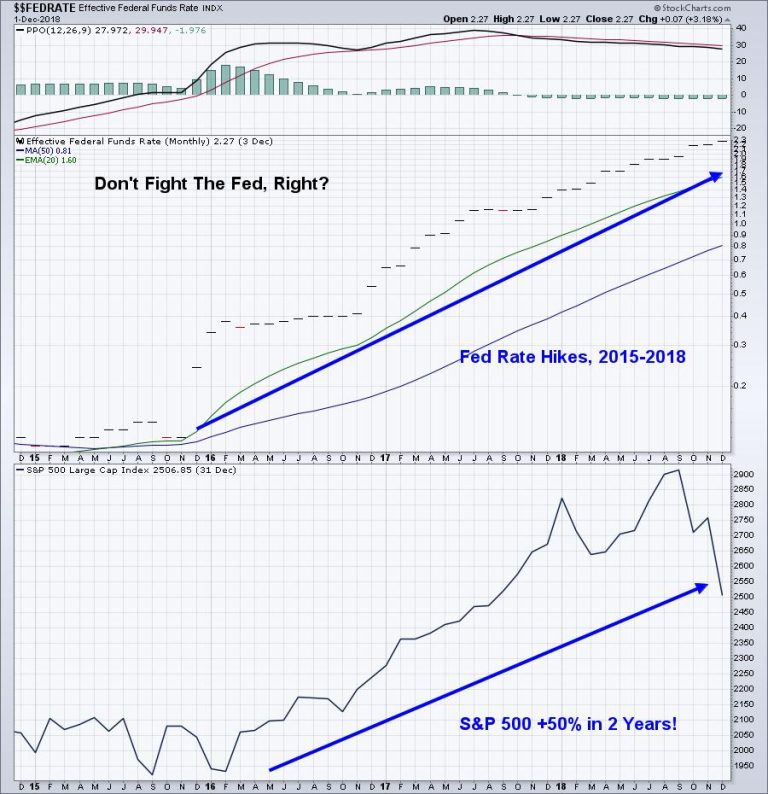
Well, since that first 75 basis point hike on June 16th, the S&P 500 is UP, not down. We’ve had four 75-basis point hikes, two 50-basis point hikes, and two 25-basis point hikes. In my opinion, all of it was built into stock prices at the June 2022 low. How else do you explain the significant rate hikes over the past year and an S&P 500 that is 10% higher than it was when the first 75-basis point rate hike was announced? Stop listening to CNBC and the media clowns and pay attention to those who actually do research – like EarningsBeats.com. 2022-2023 isn’t the only period where we’ve seen a number of rate hikes coincide with stock market strength. Do you remember early 2016 when the market bottomed and then soared? That occurred during a period when the Federal Reserve raised rates 9 times:
This chart shows the “Effective” fed funds rate, which coincides with the direction of fed funds. Good thing we “fought the Fed” during that HUGE market rally. Ohhh! And what about the 2004-2006 period when the Fed raised rates at 17 consecutive meetings!?!?!?!?!?
Whatever you do, don’t fight the Fed! (sarcasm)
I’ve actually had plenty of folks come up to me and ask how the stock market can go up when the Federal Reserve is so hawkish – that the stock market has NEVER gone up when the Fed is hiking rates. My response? Do some research and STOP listening to the media. Many authors writing articles have never done an ounce of research, but those headlines drive lots of interested viewers! Quite honestly, that’s all that matters for most authors. Drive that viewership!
Market Rotation
Let me tell you what’s been happening “under the surface” of the stock market. Actually, before I do, let me show you why I told everyone that a cyclical bear market was a real threat as we entered 2022 at all-time highs. A huge part of it was sentiment (and I’ll get to that in a minute), but another big part was market rotation into defensive areas. As the S&P 500 printed its all-time high in January 2022, Wall Street was repositioning in those defensive areas. Lots of Monday morning quarterbacks will tell you how they pointed out the bear market. The problem is that most of them pointed out the bear market after it happened. What good does that do? I fired warning shots in December 2021. On the last day of that December, I wrote an article, “It Could Be A Very Rough Start To 2022”. That was just one day before the all-time high was set. I’ve had dozens and dozens of emails and feedback from EarningsBeats.com members, indicating how much money they saved by exiting stocks at the beginning of 2022. And it was as simple as following a few key charts. Here was one of them:
That red-dotted vertical line represented a MAJOR warning signal for stocks as the bulls’ last gasp came after significant bearish market rotation took place. Let’s see, should we follow the intermarket relationships or tune into CNBC? Those who used the former and avoided the latter did quite well in 2022.
But now the bulls are getting excited. Why? Because the intermarket relationships no longer favor the bears. Money is rotating quite bullishly into growth areas. Here’s the same chart as the one above, but this time for the past six months:
The growth ratios I follow are all soaring. Wall Street is repositioning into growth and this has been occurring throughout 2023. Ask yourself why. For everyone that’s now screaming “inverted yield curve” and “recession”, why would money rotate so heavily into growth stocks. It doesn’t make sense, and that’s why you need to pay attention to it.
But market rotation isn’t even the most bullish signal.
Sentiment
The equity-only put-call ratio ($CPCE) is my “go to” chart when I want to understand how retail traders feel about stocks. And when the 253-day (1 year) moving average of the CPCE begins to turn – and it doesn’t happen often – you need to take note. Extreme readings, either to the upside or downside, can mark major stock market bottoms and tops, respectively. Here’s how this chart looked on Saturday, January 8, 2022, at our 2022 MarketVision event:
The red arrows mark reversals in long-term downtrends. These are reversals off EXTREMELY bullish readings and sentiment indicators are contrarian indicators. They essentially tell you to “batten down the hatches” and grow much more defensive, or even think about shorting the stock market. The opposite is true when this 253-day moving average reaches a stop and begins to roll over. On the chart above, it doesn’t appear as though we’re quite ready to roll over, but I’ve used a User-Defined Index at StockCharts to track what I consider to be a much more reasonable CPCE. There were several outrageously-high daily readings in November and December of 2022, due to unusual hedging activities of institutions. They skewed the readings on the CPCE and needed some adjustment to more accurately reflect the true psyche of the retail trader. After making those adjustments, here’s how my “adjusted” CPCE chart now looks:
The long-term 253-day moving average is just beginning to roll over and if you look above at the earlier CPCE chart, you’ll see that when this rolls over, the S&P 500 begins to soar.
If the stock market was chess, and I was on the bull side, then I’ve been calling “Check” for a few months now. I’m calling “Check” one last time. We’re about to witness “CheckMATE”. It’s time to ditch your bearish thoughts. Stocks are about to scream higher. The Fed is our wild card short-term, but once the effects of this meeting dies down, stocks will soar.
If you’d like REAL research and facts and what truly drives the stock market, you need to join us at EarningsBeats.com. I’m never short on conviction. Even if you disagree with my views, I’ll provide you interesting insight to make better investment decisions. If you think knowing that a bear market was coming before it ever arrived would have helped you in 2022, then I believe following us at EarningsBeats.com in 2023 during a massive rally will prove quite beneficial as well. CLICK HERE to get your FREE 30-day trial started!
Happy trading!
Tom

