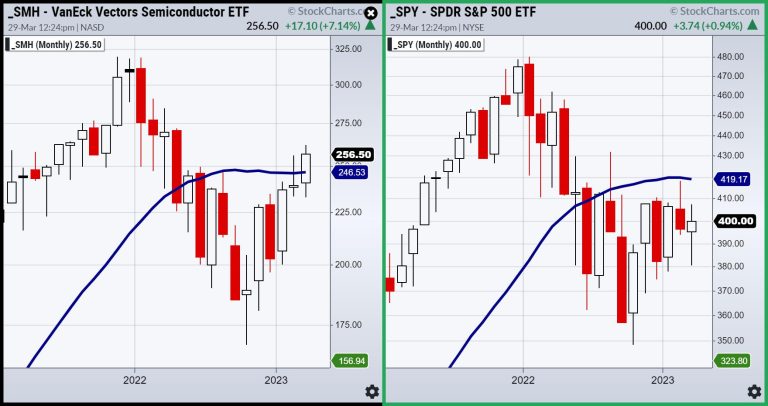
We have written lots of Dailys, not to mention talked a lot in media, about the significance of the 23-month moving average. Here are some past comments:
What has happened in the last 2 years? A bullish run in 2021 based on easy money. Inflation running hotter than most expected.
The banks were caught off guard, and by 2022, the party was over.
So, that begs the question of why this year’s 23-month moving average is one of the most important indicators for equities.
In general, the business cycle consists of four distinct phases: expansion; peak; contraction; and trough. And it takes about 4.7-5 years to run through the cycle. However, in the spirit of our new paradigm, or rules that are square pegs fitting into round holes, we must ask:
Was Covid the trough?Was the expansion in 2021?The peak January 2022?The trough in October 2022?And now, 2 years later, expansion again?
No need to stress about that, though–we just need to watch the charts.
With only 2 more days until the end of the month and the quarter, we see one area potentially expanding further, while the key index SPY, has more to go. Plus, we have learned from the past; chip stocks can lead only so far before they run out of gas from pulling the economic boat all by themselves.
The 23-month moving average, or just shy of a 2-year business cycle, speaks volumes. The Semiconductor ETF SMH is clearing the 23-month MA assuming it can stay above that level through the end of the day this Friday. If SMH sells off from here, failing the blue line, well, that would be very informative, not to mention embolden the bears. However, if SMH does indeed close above the blue line, what might be expected as we start the 2nd quarter?
The SPY chart tells us a different story. SPY remains rangebound somewhere between 380-405. Over 405, it could run to 420–the moving average resistance.
Maybe SMH is at 265-270 if SPY gets to 420–but then what? For now, with yields higher, anything is possible. However, I would respect how this month closes relative to the MAs.
Expansion can begin with tech and trickle down to other sectors. Or tech could just as easily reverse course in these skittish times.
Register for free for Real Vision’s Festival of Learning! A treasure trove of experts to answer your questions.
For more detailed trading information about our blended models, tools and trader education courses, contact Rob Quinn, our Chief Strategy Consultant, to learn more.
IT’S NOT TOO LATE! Click here if you’d like a complimentary copy of Mish’s 2023 Market Outlook E-Book in your inbox.
“I grew my money tree and so can you!” – Mish Schneider
Get your copy of Plant Your Money Tree: A Guide to Growing Your Wealth and a special bonus here.
Follow Mish on Twitter @marketminute for stock picks and more. Follow Mish on Instagram (mishschneider) for daily morning videos. To see updated media clips, click here.
Mish in the Media
In this appearance on CMC Markets, Mish gives you clear actionable information to support why commodities look to go higher from here.
Mish talks looking for stock market opportunities on Business First AM.
Mish discusses long bonds, Silver to Gold and the Dollar in this appearance on BNN Bloomberg.
Mish sits down with Kristen on Cheddar TV’s closing bell to talk what Gold is saying and more.
Mish and Dave Keller of StockCharts look at longer term charts and discuss action plans on the Thursday, March 17 edition of StockCharts TV’s The Final Bar.
Mish covers current market conditions strengths and weaknesses in this appearance on CMC Markets.
Mish sees opportunity in Vietnam, is trading SPX as a range, and likes semiconductors, as she explains to Dale Pinkert on ForexAnalytix’s F.A.C.E. webinar.
Mish and Nicole discuss specific stock recommendations and Fed expectations on TD Ameritrade.
Coming Up:
March 30th: Your Daily Five, StockCharts TV
March 31st: Festival of Learning Real Vision “Portfolio Doctor”
April 4th: The RoShowPod with Rosanna Prestia
April 24-26: Mish at The Money Show in Las Vegas
May 2-5: StockCharts TV Market Outlook
ETF Summary
S&P 500 (SPY): Nice job SPY; 400 pivotal.Russell 2000 (IWM): 170 support, 180 resistance.Dow (DIA): 325 pivotal.Nasdaq (QQQ): 305 support, 320 resistance.Regional Banks (KRE): Weekly price action more inside the range of the last 2 weeks.Semiconductors (SMH): After testing 250, SMH sprouted Wonder Woman wings.Transportation (IYT): 223 now resistance with 219 key support.Biotechnology (IBB): Cleared the 200-DMA at 127, so now needs to hold it.Retail (XRT): Still weakest besides KRE as far as Economic Modern Family, so, if rally holds, it has to be with Granny in it. 60 key support.
Mish Schneider
MarketGauge.com
Director of Trading Research and Education

