After recent price cuts and low expectations of only $.85 per share or a 20% drop since a year ago, many eyes will watch Tesla (TSLA) after the close.
Tesla, always controversial, can either beat those low expectations and provide a low risk buy opportunity against major moving averages,
Or
With Musk on a call shortly thereafter the numbers are published, he can just as easily talk the price down.
Regardless, it is always about the expectations and forward guidance, regardless of how many analysts chime in ahead of time with their predictions. That and, of course, the price charts.
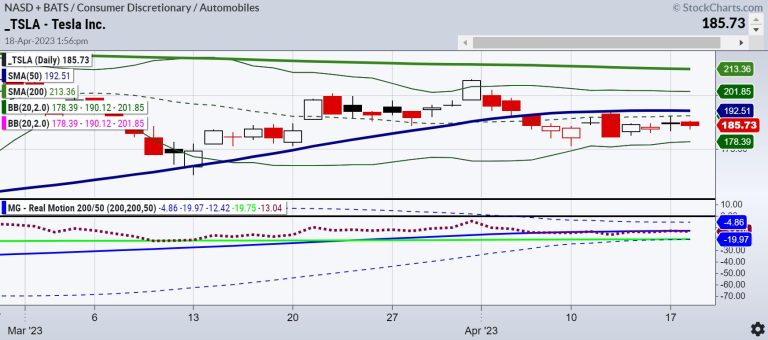
The first chart is a Daily timeframe. The divergence between momentum and price is most interesting. While our Real Motion says bullish phase and the indicator sits right on the 50-daily moving average, the price says bearish phase.
A move over the 50-DMA in price or 192.50 would be compelling based on the better momentum. On the weekly chart, price is better than momentum.
The $177 level is big support to hold based on the 200-WMA. Momentum is in a bearish phase, while price is in a caution phase. Hence, a move over 192.50 could take price up to around 215 next. Under 177, and we could see 120-125 just as easily.
For more detailed trading information about our blended models, tools and trader education courses, contact Rob Quinn, our Chief Strategy Consultant, to learn more.
IT’S NOT TOO LATE! Click here if you’d like a complimentary copy of Mish’s 2023 Market Outlook E-Book in your inbox.
“I grew my money tree and so can you!” – Mish Schneider
Get your copy of Plant Your Money Tree: A Guide to Growing Your Wealth and a special bonus here.
Follow Mish on Twitter @marketminute for stock picks and more. Follow Mish on Instagram (mishschneider) for daily morning videos. To see updated media clips, click here.
Mish in the Media
Mish presents two stocks to look at in this appearance on Business First AM — one bullish, one bearish.
Mish joins David Keller on the Thursday, May 13 edition of StockCharts TV’s The Final Bar, where she shares her charts of high yield bonds, semiconductors, gold, and regional banks.
Mish joins Wolf Financial for this Twitter Spaces event, where she and others discuss their experiences as former pit traders.
Mish shares her views on natural gas, crude oil and a selection of ETFs in this appearance on CMC Markets.
Mish talks what’s next for the economy on Yahoo! Finance.
Mish joins Bob Lang of Explosive Options for a special webinar on what traders can expect in 2023!
Rosanna Prestia of The RO Show chats with Mish about commodities, macro and markets.
Mish and Charles Payne rip through lots of stock picks in this appearance on Fox Business’ Making Money with Charles Payne.
Coming Up:
April 19th: Closing Bell on Cheddar TV
April 20th: Benzinga Pre-Market Prep
April 24-26th: Mish at The Money Show in Las Vegas — two presentations and a book giveaway
April 28th: Live Coaching Complete Trader and TD Ameritrade with Nicole Petallides
May 2nd-5th: StockCharts TV Market Outlook
ETF Summary
S&P 500 (SPY): Tight range to watch this week, 412-415.Russell 2000 (IWM): 170 support-180 resistance.Dow (DIA): Peeking over the 23-month MA 336; impressive if holds.Nasdaq (QQQ): 312 support over 320 better.Regional banks (KRE): 41.28 March 24 low held, now has to clear 44.Semiconductors (SMH): 258 resistance with support at 250.Transportation (IYT): 219-228 the wider range to watch.Biotechnology (IBB): 130 major pivotal area-135 resistance.Retail (XRT): 58-64 trading range to break one way or another.
Mish Schneider
MarketGauge.com
Director of Trading Research and Education

