Author

admin

Browsing

Even the biggest Grinches on Wall Street might need to rethink their outlook for the final trading days of 2023, as U.S. stocks rallied on surprising consumer confidence numbers and strong earnings from Nike (NKE) and FedEx (FDX). This is cause for some holiday cheer, signaling that good financial news can be found during tumultuous times.

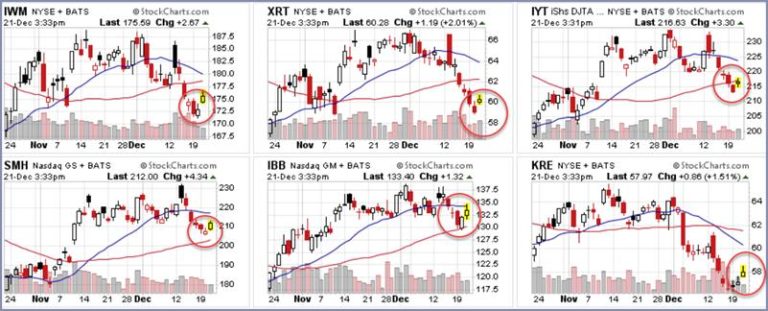
The above chart shows Mish’s Modern Family members and their 20-day and 50-day moving averages over the last two months. The “Modern Family” comprises six key exchange-traded funds (ETFs) symbols that provide a comprehensive guide to the stock market. Each family member is recovering in price today, with IBB leading and KRE being the weakest link.

Semiconductors have been a significant drag on Wall Street. We’ll examine Sister Semiconductors (SMH) and see what she says about it now.

Mish’s Modern Family is a reliable gauge for measuring overall macro factors, and analyzing family members and their relationships can help to see less obvious market patterns. A diversified and systematic approach to managing risk, trades, and portfolio strategies is essential, which is why we continue to monitor all members of the Modern Family daily.

No matter what happens in the stock market on any given day, there will always be stocks and sectors that zig – when others zag. SMH is a valuable gauge for any trader, investor, or financial professional evaluating the tech sector.

Sister Semiconductors is attempting to regain her 200-day moving average. SMH briefly crossed the 200-day moving average before finding support near the 50-day moving average. If SMH regains its 200-day moving average in the coming weeks and holds, this could signal a significant market shift.

Yet, the continued uncertainty in global markets has caused many investors to avoid the semiconductor industry. Weak sales have weighed heavily on chipmakers, including Intel (INTC), Qualcomm (QCOM), Texas Instruments (TXN), AMD, Micron (MU), and Nvidia (NVDA), to name a few. While some investors are rightly concerned, there is also an opportunity for savvy investors with market timing and trading knowledge to invest in sister semiconductor companies’ price recovery.

If you’re interested in learning more about how Real Motion can help you trade with an edge, contact Rob Quinn, our Chief Strategy Consultant, who can provide more information about Mish’s Premium trading service with a complimentary one-on-one consultation.

“I grew my money tree and so can you!” – Mish Schneider

Get your copy of Plant Your Money Tree: A Guide to Growing Your Wealth and a special bonus here.

Follow Mish on Twitter @marketminute for stock picks and more. Follow Mish on Instagram (mishschneider) for daily morning videos. To see updated media clips, click here.

Mish in the Media

In this appearance on Business First AM, Mish discusses why she’s picking Nintendo (NTDOY).

Mish sits down with Gav Blaxberg for a W.O.L.F podcast on what she has learned as a trader and teacher.

In this appearance on Business First AM, Mish explains how even the worst trade should not be too bad with proper risk management.

In this appearance on Real Vision, Mish joins Maggie Lake to share her view of the most important macro drivers in the new year, where she’s targeting tradeable opportunities, and why investors will need to keep their heads on a swivel. Recorded on December 7, 2022.

Mish sits down with CNBC Asia to discuss why all Tesla (TSLA), sugar, and gold are all on the radar.

Read Mish’s latest article for CMC Markets, titled “Two Closely-Watched ETFs Could Be Set to Fall Further“.

Mish talks the current confusion in the market in this appearance on Business First AM.

Mish discusses trading the Vaneck Vietname ETF ($VNM) in this earlier appearance on Business First AM.

ETF Summary

S&P 500 (SPY): 380 support and 390 resistance.Russell 2000 (IWM): 170 pivotal support and 180 resistance.Dow (DIA): 330 support and 337 resistance.Nasdaq (QQQ): 269 support and 278 resistance.Regional banks (KRE): 53 support and resistance 61.Semiconductors (SMH): Support is 205, resistance is 217.Transportation (IYT): 211 pivotal support and 222 is now resistance.Biotechnology (IBB): 130 is pivotal support and 139 overhead resistance. Retail (XRT): 57 pivotal support and 63 is now resistance. Regained 60.

Mish Schneider

MarketGauge.com

Director of Trading Research and Education

Wade Dawson

MarketGauge.com

Portfolio Manager

Reminder: Prices go up for new DecisionPoint.com subscriptions in January. Details are below the article.

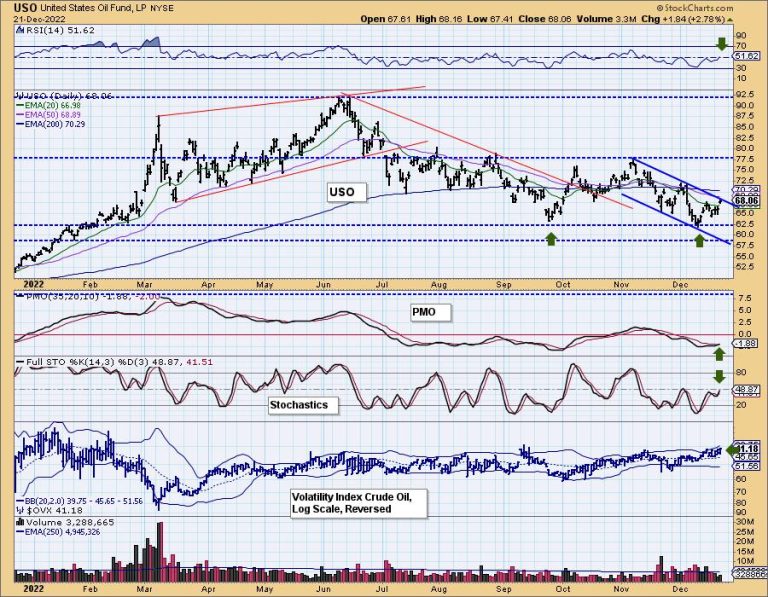
Crude Oil has been in a short-term declining trend since the beginning of November. Big picture, it is in a large trading range. After spending so much time being beat down, crude is finally making the turn. This looks more promising than the last rally, as the PMO didn’t confirm it.

Price hasn’t managed to pull out of its declining trend channel, but today’s big gap up move does suggest it will. The indicators also favor a breakout. The RSI just moved into positive territory, and the PMO triggered a crossover BUY signal today. Stochastics are also confirming as they rise again toward positive territory above net neutral (50).

We also follow the volatility index for Crude Oil ($OVX). As with the VIX on its inverted scale, we look where it is in relation to its moving average to determine internal strength and weakness. Currently, it is oscillating above its moving average, which implies internal strength. We also would like to point out that we could be looking at an intermediate-term double-bottom forming.

TLT also saw a new PMO crossover, but to the downside. This PMO SELL signal looks very dangerous, as it is coming in very overbought territory. The correction in interest rates is over in our opinion, so we expect TLT to return to the strong support zone at the November lows. Price managed to close above the 50-day EMA, but it is barely hanging on. The RSI moved into negative territory and Stochastics are dropping vertically. This appears to be the end of the rally in TLT as the 20-year yield recovers.

Watch the latest episode of DecisionPoint on StockCharts TV’s YouTube channel here!

Our prices are going up in January!

If you’ve thought about getting a DecisionPoint subscription, now is the time to subscribe! Our prices will be going up! Our Bundle currently is $68/month, but, in January, it goes up to $119/month. The DP Alert will go from $35/mo to $50/month. DecisionPoint Diamonds will go from $40/month to $80/month. So don’t delay! Once you subscribe, you get to keep your low rate even when we raise prices! **

** In order to keep your low rate, your subscription must continue running and remain in good standing.

Technical Analysis is a windsock, not a crystal ball. — Carl Swenlin

(c) Copyright 2022 DecisionPoint.com

Helpful DecisionPoint Links:

DecisionPoint Alert Chart List

DecisionPoint Golden Cross/Silver Cross Index Chart List

DecisionPoint Sector Chart List

DecisionPoint Chart Gallery

Trend Models

Price Momentum Oscillator (PMO)

On Balance Volume

Swenlin Trading Oscillators (STO-B and STO-V)

ITBM and ITVM

SCTR Ranking

Bear Market Rules

DecisionPoint is not a registered investment advisor. Investment and trading decisions are solely your responsibility. DecisionPoint newsletters, blogs or website materials should NOT be interpreted as a recommendation or solicitation to buy or sell any security or to take any specific action.

As a development-driven company, StockCharts is always looking for ways to improve its user experience.

We needed a way for users to easily access and view the changes to our site, so, earlier this year, we switched to a release model format. If you haven’t visited StockCharts recently, here’s what you might have missed:

Starting with “Alki,” fondly named after a neighborhood in Washington State where our headquarters is also located, we rolled out scheduled scans, additional ChartLists, and the means to add earnings dates directly to your charts so you never miss a report!

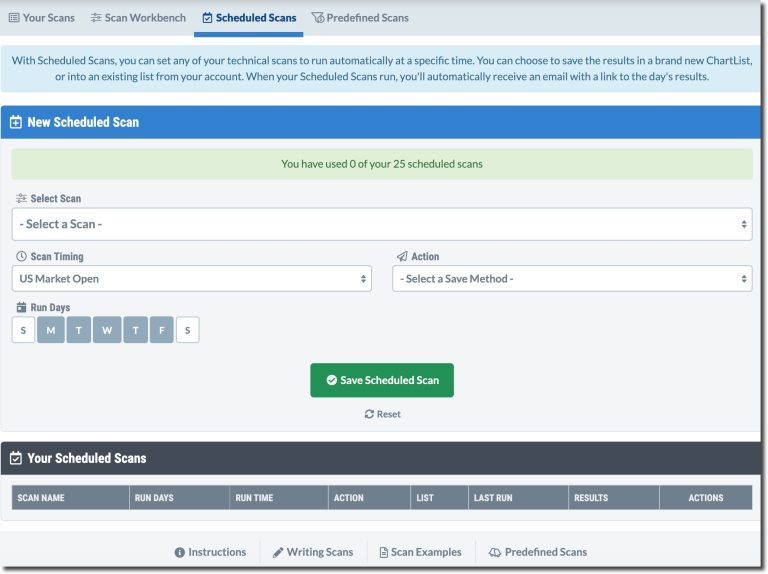
SCHEDULED SCANS. Set your scans to run on specific days of the week and/or times.

Up next was “Bainbridge.”

This was where we first introduced “Chart Panels”, which gave you the ability to pin three of your most important charts directly to your dashboard.

CHART PANELS. You can pin up to three of your charts directly to your dashboard.

Also notable was the addition of intraday chart periods, which divide each standard trading day into equal time blocks.

Now, we are up to our most recent release, “Camano,” which debuted on December 19. Perhaps our most exciting release yet, this one is chock-full of firsts!

Starting out with our biggest announcement… StockCharts officially has a mobile app! Now existing members can carry StockCharts in their pockets and be fed real-time data on the go.

MOBILE APP. StockCharts has a mobile app for iOS and iPads.

We’ve also built an earnings calendar, which includes reported results and upcoming earnings announcements!

EARNINGS CALENDAR. View reported and upcoming quarterly earnings releases.

Additionally, we took the leap into the world of options, bringing you data that includes calls, puts, volume, and open interest for the complete options chain of an underlying stock.

OPTIONS VIEW. View call, put, open interest, and volume data for underlying stocks, exchange-traded funds, and indexes.

Other features in Camano include the ability to set specific days/times for scheduled scans, a curated collection of a sample chart gallery, a sample scan library, and much more!

Learn more about our exciting Camano release here!

If these features sound like something you’d like to try, we highly encourage you to do so sooner rather than later, because, right now, you can earn up to 3 months FREE during our Holiday Special!

If you are a returning member, no problem! We make coming back easy. All member charts, preferences, and data are kept for one year, so you can pick up exactly where you left off!

As you can see, a lot has changed this year and we will continue to bring you new and improved features. While these features and updates are here to stay, our Holiday Special won’t last. Don’t delay. Take advantage of all these features and more at this deeply discounted rate! We are confident you’ll love it.

Talk Soon,

StockCharts

For a full rundown of all our releases, click here or visit www.stockcharts.com/new to learn more!

Warning! Inclement weather at the North Pole might impact Santa’s trip to Wall Street.

As the end of the year approaches, you’re likely to hear the term ‘Santa Claus rally” come up often. But what exactly is it, and how can traders and investors benefit from it?

What Is the Santa Claus Rally?

According to the Stock Trader’s Almanac, the Santa Claus rally is a short, sweet, and respectable rally that takes place within the last five trading days of the year and the first two trading days of the following year. And it tends to happen almost every year. But let’s face it; the stock market’s performance in December 2022 has been grim and doesn’t give much hope for a potential rally. Many investors are wondering if Santa may have a hard time making it out of the North Pole.

That said, in the markets, anything is possible.

Why does the Santa Claus rally happen? One theory is that, at the end of the year, investors sell off their losing positions to take advantage of tax-loss harvesting. With the cash received from the stock sales, investors turn around and buy stocks in the hope of earning returns. Another theory is that it has to do with the general optimism that’s associated with the start of a new year.

The U.S. broader markets are at a critical juncture and could go either way. The S&P 500 Index ($SPX) is at a 38.2% Fibonacci retracement level. A break below it could take it to the October lows, or even lower. The Dow Jones Industrial Average ($INDU) is sitting at its 50-day moving average. If $INDU breaks below the MA it could go much lower. And the Nasdaq Composite ($COMPQ) continues to struggle. It’s been a pretty ugly time for technology stocks, so even a short rally could be a nice gift.

There’s an interesting pattern developing in $COMPQ (see below). Bring up a weekly chart (at your own risk) to see how far $COMPQ could drop. Due to the risk of ruining your holidays and the optimism that surrounds the new year, we’ve refrained from posting the weekly chart here.

CHART 1: NASDAQ COMPOSITE AT A CRITICAL LEVEL. A break below the 10,350 level could mean the index will fall further. But, if this level holds, there might still be a Santa Claus rally. Chart source: StockChartsACP. For illustrative purposes only.

If Santa Shows Up…

If the critical levels in the broader indexes hold and the markets experience the short-and-sweet rally, you may want to take advantage of some trading opportunities. Here’s one way:

Log in to your StockCharts platform, then select Your Dashboard to get an overview of the overall market.Scroll down to Sector Summary in your Member Tools section (you’ll find it under Summary Pages).Select the top-performing sector and drill down till you find a stock or exchange-traded fund that meets your trading criteria.Review the chart and, if your technical indicators confirm an upward move, you could put on a short-term trade. But things could move in the opposite direction, so be diligent in applying stop-losses.

Even though the odds of a Santa Claus rally are high, it’s not a sure thing. If you happen to be trading during the holiday season, keep an eye on those critical levels in the broader indexes. If Santa does show up on Wall Street, remember that the rally has a very short duration.

If Santa Claus should fail to call, bears may come to Broad and Wall. — Stock Trader’s Almanac

Jayanthi Gopalakrishnan

Director, Site Content

StockCharts.com

Disclaimer: This blog is for educational purposes only and should not be construed as financial advice. The ideas and strategies should never be used without first assessing your own personal and financial situation, or without consulting a financial professional.
What will the stock market look like in 2023? It’s hard to tell, but these five charts could elevate your market awareness by a few notches.

Forecasting stock price movement is never easy, not even for the most experienced stock investor. As an investor or trader, the closest you can come is to keep an eye on a handful of charts that help give a big-picture view of the stock markets and to be aware of market internals. But which charts should you be watching?

David Keller, CMT, our chief market strategist, discussed his top 5 charts for 2022 in his StockCharts TV show The Final Bar. And the charts he used could be on your top 5 list going into 2023. Which charts make it to Keller’s top 5 list? Let’s find out.

The TL;DR

S&P 500 Index with Fibonacci retracement levels10-Year U.S. Treasury Yield IndexU.S. Dollar Index vs. gold and crude oilA mega-cap stockThe Chart, which is a combination of a broader index and sentiment indicators to help identify potential turning points in the stock market.

A Deep Dive Into the Top Charts

One of the challenges in keeping an eye on the stock markets is that there are many moving parts. These five charts make you aware of what’s going on in the most important areas of the financial markets and alert you to when investor sentiment may be changing.

Bonus Gift: Access the top 5 charts here. Save them to your ChartLists and follow along.

#1: S&P 500 Index With Fibonacci Retracement Levels

It goes without saying that one of the most talked-about charts when it comes to the stock market is the S&P 500 Index ($SPX). Money managers use it as a benchmark, but, besides that, it’s a good one to get an overarching view of the market. And when you add Fibonacci retracement levels (Fib levels) to the $SPX chart, you can identify areas of support and resistance levels and areas where investor behavior is changing.

Pull up the chart from the link above and, starting from the March 2020 low, see how $SPX reacted to the different Fib levels. You may notice that there’s a second set of Fib retracement levels from the September 2020 low to the January 2021 high. Both sets help to identify potential turning points in $SPX.

How To Add Fibonacci Retracement Levels

Bring up a chart of any stock, index, or exchange-traded fund (ETF).Select Annotate.Select Fibonacci arcs icon > Fibonacci RetracementSelect a high or low point, hold down your cursor, and drag to the low or high point to the right of your original point.Once you’re satisfied with your high and low point, release cursor, select the X on top right of chart, and save the chart.

In 2023, the 3800 level will be a key level to watch. If $SPX goes lower, the next level would be 3500 and, below that, 3200. “The bottom isn’t necessarily in for the current market cycle,” Dave noted. “January is typically the weakest month of the year, and Q1 and Q2 earnings may impact the overall markets. So, perhaps the 3200 level in $SPX is possible.”

#2: 10-Year U.S. Treasury Yield Index

Inflation is front and center in every investor’s mind, and more interest rate hikes are likely in 2023. Interest rate decisions impact the equity markets, especially when it comes to growth and value stocks. “When interest rates go higher, value stocks tend to do better and, when interest rates go lower, growth stocks tend to do better,” added Keller. For this reason, it makes sense to compare the 10-Year U.S. Treasury Yield Index ($TNX) to the performance of value to growth stocks and to look at the overall shape of the yield curve.

How to Access the Dynamic Yield Curve

From Your Dashboard, scroll down to Charting Tools in Member Tools.Select Dynamic Yield Curve.View a snapshot or animate the chart to see the changes in the yield curve.

The Dynamic Yield Curve helps to see if the curve is steep, flat, or inverted.

Interest rates are likely to go higher in 2023, which means bond and equity prices are likely to come down. But it’s possible that other themes could play out similar to what we saw in 2022—when $SPX was trending lower, the Energy sector did well in the early part of the year, and Industrials and Materials did well later in the year.

This second chart can help you see if value stocks are outperforming growth stocks. So, depending on the leadership theme, you could invest accordingly.

#3: U.S. Dollar Index vs. Gold, Crude Oil

Intermarket analysis shows how different assets—stocks, bonds, commodities, and currencies—are related. Understanding these relationships can provide additional market insight. For example, when stocks are trending lower, investors are likely to invest in risk-off assets such as gold.

The price of crude oil can impact consumer behavior—higher oil prices could reduce driving and travel, which in turn can impact airline industry performance. A stronger dollar could benefit U.S. stocks, but may have a negative impact on the earnings of companies with global operations. Understanding relationships between the different assets can help you recognize when a change is taking place.

Looking at the third chart, you may want to keep an eye on the following:

Will the U.S. dollar revert back to its mean or continue moving higher?Will gold sustain its upward move or reverse?Will crude oil continue in its downward channel?

“Intermarket relationships help you analyze trends, determine probabilities, and position yourself for what you think is the optimal scenario,” Dave added. “More importantly, investors should plan for risk, since all large losses begin as small losses.”

#4: A Mega Cap Stock

It’s always a good idea to follow one of the mega-cap growth stocks. For 2022, Keller chose to analyze the stock of Alphabet (GOOG), for the following reasons:

During the post-COVID upward phase, the FAANG stocks were dominant during the upward phase. If you pull up any of those charts, you’ll see they have a similar movement. In the GOOG chart, you can clearly see the rotation from upside leadership to falling leadership. You can recognize three of the most important investing traits—identifying trends, following trends, and anticipating when trends are exhausted.

Adding price performance against SPDR S&P 500 ETF (SPY) helps to see how GOOG is performing with respect to the benchmark. On the chart, you can see various technical scenarios play out.

The 50-day moving average (MA) crossing below the 200-day MA.A divergence between the relative strength index (RSI) and price from September to December 2021.A break below the early 2022 support level.A lower RSI range during the bearish phase.

“This chart helps to see how the investment picture changed, how the signals rotated, and what levels were established or broken,” Dave noted. “It helps you understand how to apply risk management so you’re better prepared for the next boom and bust cycle.”

The mega-cap stock you choose for 2023 may be a different one, depending on what sector does well and which stock leads in that specific sector. There are different ways to determine the broad participation of sectors, which is why the next chart is important.

#5: The Chart

The fifth chart is a series of different charts that looks at market internals. The chart at the top can vary depending on prevailing market conditions. For 2022, $SPX made it to the top of the podium. Below the line chart of $SPX is the NYSE common stock advance/decline line, percent of stocks above their 50-day MA, S&P 500 bullish percent index, and the ratio of Consumer Discretionary to Consumer Staples. Scroll below the charts to see how to recreate this setup.

A couple of things to keep an eye on:

The clear downtrend line in $SPX.From December to January 2021, $SPX was making higher highs while the NYSE Common Stock A-D line made a lower high. This was an early indication that the uptrend may be exhausted.Look to see if the percent of stocks above their 50-day MA is above or below the 50% level. When $SPX is making higher highs but this indicator is below the 50% level, it should be a red flag.For the bullish percent index, look for extreme levels in market breadth—above 70 or below 30.The ratio of Consumer Discretionary to Consumer Staples is a measure of the overall stability of the market. It gives you an idea of whether investors are gravitating towards offensive or defensive strategies. You’ll see on the chart that this indicator didn’t provide a confirming signal during the January 2022 high in $SPX.

“This chart looks at three important points—price, breadth, and leadership—which help to measure risk-on vs. risk-off mentality. When all these indicators are in agreement, it’s an indication that change is afoot,” Dave concluded.

Looking to 2023

Now that you’ve got the top 5 charts, going into 2023, what should you be looking for? Here are a few pointers:

Watch the 3500 and 3200 Fib levels in $SPX. There could be buying opportunities at these levels.Will $TNX move lower towards its 200-day MA?Will gold continue moving higher?Keep an eye out for any rotation in large-cap stocks.Watch for a break in the downward trendline in $SPX and see if it’s confirmed by the A-D line, percent of stocks above their 50-day MA, and the bullish percent index. This will help determine if investors are moving towards risk-on investment strategies.

The bottom line: There’s no Holy Grail when it comes to forecasting stock price movements, but these five charts will help you stay alert to potential changes in the market. While some themes such as higher interest rates are likely to continue in 2023, the market is known for its ability to throw surprises. Be prepared to be unprepared.

Happy holidays from the StockCharts team.

Jayanthi Gopalakrishnan

Director, Site Content

StockCharts.com


Disclaimer: This blog is for educational purposes only and should not be construed as financial advice. The ideas and strategies should never be used without first assessing your own personal and financial situation, or without consulting a financial professional.
In this episode of StockCharts TV‘s The MEM Edge, Mary Ellen reviews some of the key events driving price action as we head into the New Year. She also highlights the impact of last week’s rise in interest rates, as well as key areas of support for the broader Indexes.

This video was originally broadcast on December 23, 2022. Click on the above image to watch on our dedicated MEM Edge page on StockCharts TV, or click this link to watch on YouTube. You can also watch on our on-demand website, StockChartsTV.com, using this link.

New episodes of The MEM Edge air Fridays at 5pm PT on StockCharts TV. You can view all previously recorded episodes at this link. You can also receive a 4-week free trial of her MEM Edge Report by clicking the image below.

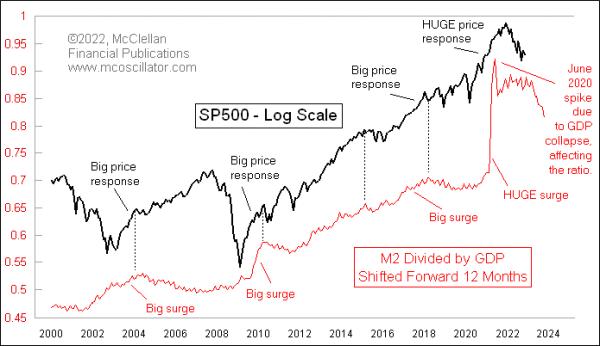
The Fed boosted the size of the money supply in a huge way because of COVID, exacerbating an upswing that was already underway in the ratio of M2 to GDP featured in this week’s chart. The cool thing about this ratio is that it tells us what is ahead for the stock market about a year ahead of time. It does so imperfectly, but it is still a useful message to listen to. And now this ratio is falling, faster than it ever has before, so we are going to get to find out what that means.

When the economy expands, there is a need for more currency to lubricate all of the financial transactions taking place. So, if the size of the money supply expands at the same rate as GDP, then there is no imbalance. If, however, the Fed increases the money supply faster than the growth in the economy, then there is excess currency that needs a mission. So that money goes looking for a job, and it tends to find gainful employment pushing up stock prices. But the key is that there is currently about a 1-year lag in this relationship.

It used to be a coincident relationship back in the 1960s and 1970s, and so brokers would gather every week around the Quotrek machines when the news was released about what M1 and M2 were doing. By the 1980s, it had changed from a coincident relationship to one that lagged about 6 months. And now, in the 21st century, the lag time is about a year. See more on this change over time here.

We are seeing something now that we have never seen before in all of the history of these monetary aggregate indices, history which goes back to 1959. M2 is shrinking, as the Fed is trying to unwind all it did when trying to “help” during COVID. And GDP is still growing, so the amount of money sloshing around compared to the size of the economy is shrinking at the fastest rate ever. This is uncharted territory, and it is a grand economic experiment that the Fed is conducting. It is not clear what is going to happen by changing this M2/GDP ratio downward at such a fast rate. We will all find out over the next year or so.

What I can say, though, is that the stock market likes it a whole lot better when the M2/GDP ratio has been surging upward. That reliably leads to a big price response about a year later. After the instances when the M2/GDP ratio has gone to a more flat path, the S&P 500 has tended to move more sideways. So, if this positive correlation holds true for this new condition that has never been seen before, with the M2/GDP ratio falling at a rapid pace, then the implication is that stock prices are going to have an awful year in 2023. But again, this is something that has never happened before, so we cannot “know” for sure what it is going to mean.

When I worked on the institutional buyside, we had the opportunity to hear from lots of brokers, strategists, and analysts in the industry. And I was thrilled to have some of the top technical analysts around coming through to talk charts with us. One of my favorite questions to ask was, “What was your worst call in the last six months, and what did you learn from it?”

For a professional strategist, dwelling on bad calls is certainly not how you want to spend your time. You’d much rather talk up your exceptionally prescient calls that everyone should hear about! But if you want to become a better investor, you need to spend less time celebrating your wins and more time dissecting your losses. And if you want to become a more successful investor, these are the kinds of questions you should be asking after a big miss:

What evidence did you miss that would have pointed you to a more ideal conclusion?What tools could you add to your toolkit to better manage this sort of environment the next time it comes around?How could you better spend your time during the day/week to make sure you’re better equipped to understand what’s happening around you?What could you do to improve your money management processes to more effectively manage risk when you are wrong?

These are the questions that are really only answered if you approach year-end as a time to reflect constructively on your experiences as an investor.

That brings me to the ten questions that I ask myself every year, with the goals of improving my investment performance, reviewing missed opportunities, and upgrading my routines. I’m happy to share with you now my answer to probably the most painful question of the ten: “What was your worst trade, and what did you learn from it?”

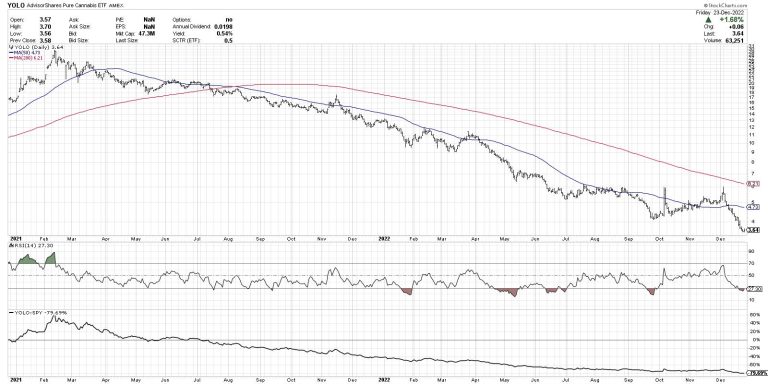
While, overall, I feel pretty good about remaining bearish through most of 2022, I had a couple big misses. And that brings us to the chart of YOLO, one of the US-listed cannabis ETFs.

Now to be clear, I very much consider myself a trend-follower. My goal is not to buy the bottom, pretty much ever. Rather, I’d like to wait until there are some “signs of accumulation” in the form of price improvement and bullish momentum characteristics.

Knowing this fact, you may reasonably ask yourself why I thought YOLO was a good buy at $6.

The non-technical reason is that I believe in the long-term potential for the cannabis industry, similar to how I feel about the long-term potential of blockchain technology. I see the signs now that tell me there is tons of upside for these emerging themes. But, as Jon Markman so aptly described in his book Fast Forward Investing, even if you know that a certain theme is going to work over the long-term, there is no guarantee as to which products, companies, and trading vehicles will benefit the most as these themes become more developed over time.

That brings me to the clear technical evidence against buying YOLO at $6, which I clearly ignored at the time. Here’s my chart, but with some additional annotations to help illustrate what I could only describe as confirmation bias run amok.

First off, the chart started making lower highs and lower lows in early 2021, after the excitement from the 2020 election cycle had all worn off. Cannabis stocks had experienced a big upswing in the fourth quarter of 2020, but, by spring 2021, a downtrend was clearly in place.

I remember exactly what caught my eye in July and August of this year. Quite simply, I noticed that YOLO wasn’t going any lower. The lower lows (which had been a signature move on this chart for about 16 months) had dissipated, and the chart appeared to have stopped its endless decline.

Now did the price actually break above resistance? No. And that’s where I missed one of the basic tenets of the Dave Keller investment process–to wait for confirmation of any change.

I’ve spoken and written about follow-through days, or the two-day rule, or whatever you want to call the idea that you need confirmation of a breakout before declaring the breakout. I did not have the patience to wait for a break above $6. So, instead of waiting for a breakout, I placed the order around $6. And I’m still waiting for that upside follow-through, with YOLO having broken below $4 this week.

Next, I ignored the momentum characteristics, which were clearly still negative. Note how many times the RSI bumped up to around the 60 level on short-term rallies, only to see the price revert lower soon after. In early December, the RSI briefly broke above 60, but, as this was happening, the price was forming a shooting star candle with an intraday high right at the well-established resistance level of $6.

Finally, and perhaps most embarrassingly, we have the long-term chronic underperformance, as illustrated by the relative strength ratio in the bottom panel.

So, in this case, I ignored something I tell our viewers at least 12 times a week: focus on charts with improving relative strength.

Full disclosure: I still own the position in YOLO. It’s in a retirement account and I’m happy betting on long-term upside for this industry group. But, in my excitement at seeing a stalled downtrend in a group of which I’m fundamentally bullish, I managed to ignore what now appear to be clear signs that the chart was still bearish.

Why am I taking the time to relive this colossal miss at year-end 2022? Because I want to become a better investor, every single year. And the only way I’m really going to do so is by owning up to mistakes, reflecting on my decision-making process, and making changes to minimize the chances of having a similar mishap in 2023.

Your turn. What was your worst trade in 2022, and what did you learn from it?

By the way, want to see the other nine questions I ask myself at year-end? Just head on over to my YouTube channel.

RR#6,

Dave

P.S. Ready to upgrade your investment process? Check out my YouTube channel!

David Keller, CMT

Chief Market Strategist

StockCharts.com

Disclaimer: This blog is for educational purposes only and should not be construed as financial advice. The ideas and strategies should never be used without first assessing your own personal and financial situation, or without consulting a financial professional.
The author does not have a position in mentioned securities at the time of publication.   Any opinions expressed herein are solely those of the author, and do not in any way represent the views or opinions of any other person or entity.

The stock market has always come up with ways for challenging investors. What seems to be so obvious rarely works out, and what seems to be irrelevant surprises you months later with a chart from the bottom left to the top right.

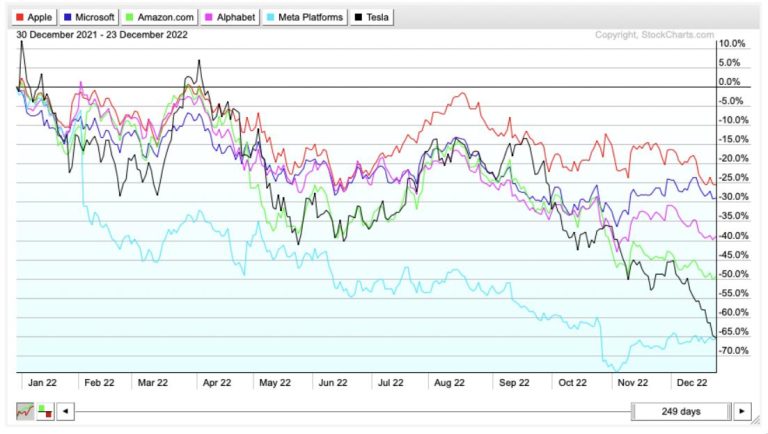
The Nasdaq is now the qadsaN index, as it spent the year going backward. All the mega cap names were sold off.

The electric bears have been taking a swipe at the electric car business for a while, but they picked up speed, swiping 68% off Tesla. They have taken a lot more percentage from other EV names, but Tesla was by far the largest market cap value change. A year ago, we couldn’t get Tesla bulls off the podium. Meta and Alphabet got shellacked, along with the rest of the communications business. Amazon dropped 50% after maintaining a big price/earnings ratio for years. Microsoft and Apple also dropped meaningfully. I am not sure anyone expected the extent of the selling in the special six.

One of the things I am surprised about is how the Nasdaq is only down 30%, despite the juggernauts being down so much. There are actually a full 25 Nasdaq 100 stocks positive on the year! I know, that surprised me too.

Professional Management

So the rotation under the surface has been massive. All those long term portfolio strategies would be interesting to review. Were they able to adjust for the selling in the large caps, or too stubborn to change? This is a year where technical analysis should perform better than the fundamental analysis. Everybody’s boat rises in a bull market.

ARKK

I think the ARKK chart set a record for an ETF this year, and had a SCTR ranking below 10% for the whole year. Most of the year, it was the worst 1%. Yet it still attracted capital inflows. That is remarkable story-telling. Yes, I never want to short innovation, but it should be priced right before I invest in it.

For me, just a few weeks ago, I published an article about the oil stocks breaking down. There is a reason we look at the charts every week. When things change, we need to change as well. I will be discussing that area of the market in my weekend newsletter, and you can see everything we do at Osprey Strategic for just $7 for the first month.

Have a wonderful holiday season and let’s hit it hard in 2023!

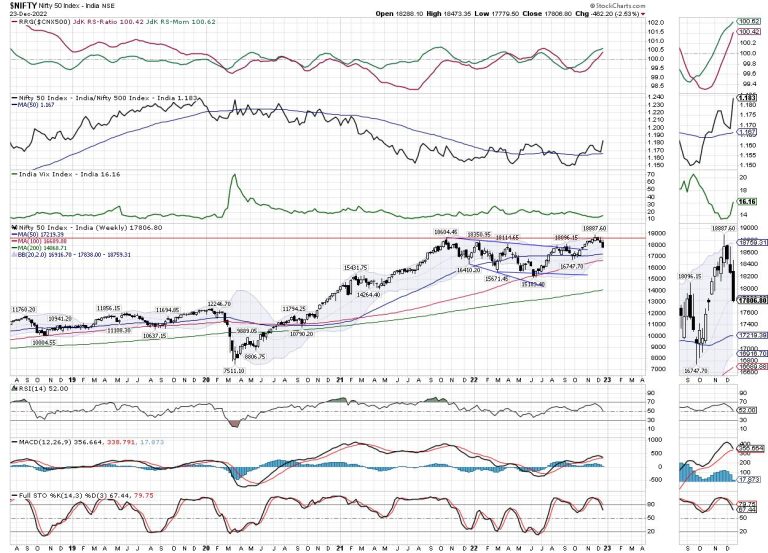
Over the past few days, the levels of 18600 on NIFTY have assumed a lot of importance as the index had staged a breakout above this point but ended up slipping below this level following a full throwback. In the previous editions of weekly technical notes, it has been mentioned quite often that any failure to stay above 18600 will not only mean a failed breakout for the markets but may also push NIFTY in some more extended corrective consolidation. The week before this one had seen NIFTY slipping below this point; the previous week saw the index extending its downside. While seeing a wider trading range of 693 points, the Index staged a corrective decline and ended with a net loss of 462.20 points (-2.53%) on a weekly basis.

The previous two weeks have been technically damaging ones; the slipping of NIFTY below 18600 levels has dragged the resistance levels lower for the Index. Now, the zone of 18400-18600 represents a very strong resistance zone for the markets going ahead from here. For any resumption of up-move to occur, moving past this zone will be required. Until this happens, NIFTY will continue to display a corrective undertone. The Index has closed a notch below the shorter 20-week MA which currently stands at 17838. If this is not defended on a weekly closing basis, this may lead to some incremental weakness. If this point is defended, this may keep markets under prolonged consolidation.

Volatility spiked as INDIAVIX surged 14.85% to 16.16 on a weekly basis. The global markets have shown some respite from the downside; this may help our markets to begin the week on a relatively stable note. The coming week is expected to see levels of 17930 and 18220 acting as potential resistance points. The supports come in at 17710 and 17580 levels.

The weekly RSI is 52; it is neutral and does not show any divergence against the price. The weekly MACD is bullish and remains above the signal line. However, the narrowing slope of the Histogram shows that this indicator may show a negative crossover in the coming days.

The pattern analysis of the chart shows that the NIFTY attempted a breakout by moving past the previous lifetime high point of 18604; however, after testing 18887 levels, the index not only retested the breakout point of 18600 but also significantly slipped below that level as well. As of now, the attempted breakout has failed and NIFTY continues to face strong resistance at 18600 levels.

The holiday season is likely to keep overall volumes at lower levels; this may likely keep the overall markets within a defined range. There are strong possibilities of a technical pullback given the kind of one-way decline that we have witnessed. This being said, the action will continue to remain highly stock-specific in nature. We may see the defensive pockets doing well but the renewed-covid fears may well keep the markets a bit tentative over the coming days. It is strongly recommended that leveraged positions must be kept at modest levels and profits on either side of the move must be vigilantly protected. A cautious outlook is advised for the week.

Sector Analysis for the coming week

In our look at Relative Rotation Graphs®, we compared various sectors against CNX500 (NIFTY 500 Index), which represents over 95% of the free float market cap of all the stocks listed

The analysis of Relative Rotation Graphs (RRG) shows the PSE Sector Index has rolled inside the leading quadrant. This index, along with Metal, Nifty Bank, PSU Bank, Infrastructure, Commodities, and Financial Services index that are inside the leading quadrant, is likely to relatively outperform the broader NIFTY500 Index.

The FMCG index continues to remain in the weakening quadrant. 

The Midcap 100 index has rolled inside the lagging quadrant. Besides this index, Nifty Consumption, Auto, Realty, and Media indices are also seen languishing inside the lagging quadrant.

The Energy Index has rolled inside the improving quadrant and may show stock-specific outperformance along with the IT index which is also inside the improving quadrant. The NIFTY Pharma index is also inside the improving quadrant but it appears to be sharply giving up on its relative momentum.

Important Note: RRG™ charts show the relative strength and momentum for a group of stocks. In the above Chart, they show relative performance against NIFTY500 Index (Broader Markets) and should not be used directly as buy or sell signals.  

Milan Vaishnav, CMT, MSTA

Consulting Technical Analyst

www.EquityResearch.asia | www.ChartWizard.ae