By the time this article hits the presses, there may be a fully developing civil war in Russia.
Two weeks ago in this space, I noted that the AI-fueled rally was due for a pullback. And the Fed and a cadre of central banks gave sellers the excuse to take profits.
And just to make life interesting, the news of major problems in Russia broke over the weekend and are rapidly developing as I go to press. Reports suggest that the leader of Russia’s mercenary group, Wagner, is trying to implement a coup against Putin. And Putin is retaliating. The situation seems to be deteriorating rapidly as there are reports of clashes between Wagner fighters and Russia’s military in southern Russia.
Let’s See What the Fed Does
Fed Chairman Powell, in his recent congressional testimony, warned that the central bank will resume its interest rate hiking cycle as inflation isn’t where the central bank wants it. His comments coincided with worse-than-expected inflation news from the U.K., which registered 7.1% year over year growth in its core inflation measure. The Eurozone’s core inflation seems to be slowing as the region is now in a confirmed recession. In the U.S., Consumer prices remain elevated, but are flattening out while producer prices plunged in the latest report.
So, is Powell just talking? Who knows? But with the situation in Russia rapidly deteriorating, what the Fed and other global central banks do next is anyone’s guess. What is most likely is that the events in Russia will increase volatility in the U.S. Dollar, gold, crude oil, U.S. Treasury bonds and, of course, stock index futures.
Of course, these events in Russia couldn’t come at a worse time, since the Bank of England, the Swiss National Bank, and the central bank of Norway all raised interest rates on 6/22/23, with expectations rising for more rate hikes from the European Central Bank and tough talk from the Fed about raising rates two more times in 2023. Furthermore, the rise in U.S. jobless claims continues. This time, California, Connecticut, and New Jersey led the way as tech layoffs may be gathering steam. Existing home sales were flat year-over-year as the usual supply shortage, combined with mortgage rates, continue to have a negative effect. New home sales are not struggling. Meanwhile, the U.S. leading economic indicator fell for the 14th straight month.
All of this comes as PMI data shows the manufacturing component of global and U.S. PMIs is slowing rapidly, as new orders are drying up and the services sector is showing signs of slowing.
Watching the Bond Market; Global Economy Shows Signs of Slowing as Russian Events Develop
The bond market’s reaction to talk of inflation and higher interest rates is, in many ways, more important than what influential people say or do. That’s because bonds are the most inflation-sensitive financial instruments available. At the same time, U.S. Treasury bonds are considered the ultimate flight to safety instruments in the world. That notion is about to be tested as the Russian situation develops.
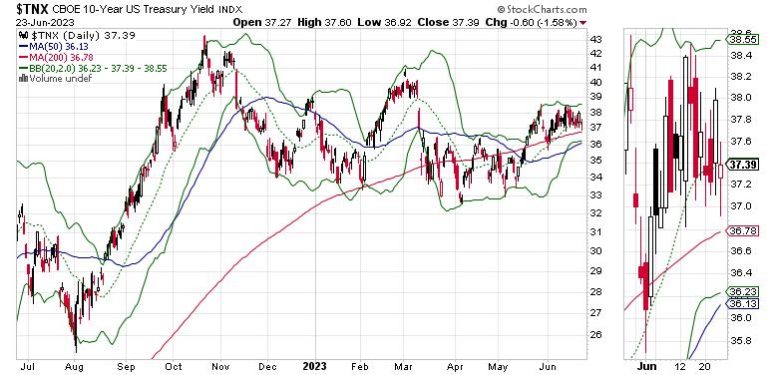
You can see that, although yields initially rose on Powell’s testimony and the global rate hikes, by week’s end, TNX remained well below the highs reached in late 2022. If history is any guide, the Russian events should lead to big money moving into U.S. treasuries and lower yields.
Watch the 3.6% yield zone on the down side and 3.85% on the up side. If treasuries react to this developing crisis as they have in the past, we may see a significant drop in bond yields.
The U.S. Dollar Index (USD) is also worth watching. Keep an eye on the 103-105 trading range. Moves above or below that will be meaningful if they last.
Also watch the action in crude oil (WTIC) as traders begin to handicap the potential for Russian oil supplies, which have been quietly flooding the world of late, to be disrupted.
We’ll also be watching what happens to mortgage rates and the housing market, especially the homebuilder stocks in the U.S., as the Russian situation develops. Depending on how the markets react, lower yields may have positive effects on home builders and REITs.
That’s because with lower bond yields, as the chart above shows, we’re already seeing an increase in mortgage activity.
Incidentally, thanks to all the members and followers who have joined my Buy me a Coffee page, where I expect to be very busy in the next few days along with sending Flash Alerts to subscribers. Meanwhile, you can check out my Weekly Real Estate Roundup here and here. That’s where I offer crucial market updates in an easy-to-follow and highly accessible format. This crucial information complements the stock picks at Joe Duarte in the Money Options.com.
Bullish and Bearish Stock Sectors
It’s also important to see how stocks see Mr. Powell’s remarks and the Russian developments will be reflected in money flows, especially in a sector-specific manner.
The market’s recent leadership, technology and homebuilders, went in opposite directions, with the homebuilders (SPHB) pushing higher due to the long term demographic megatrends, which continue to exert their bullish influence on the group.
The highly overbought semiconductors (SOX) continued their pullback, but held at their 20-day moving average as the crowd who missed the first leg of the rally buy on the dip.
Perhaps the most interesting action was in the retail sector (RLX), where the bargain shopper subsector is getting a bid from investors who are starting to price in a recession.
All the above charts show the relationship between the action in TNX and the particular sector of interest.
NYAD Breaks Below 50-day Moving Average
The New York Stock Exchange Advance Decline line (NYAD) finally gave in to selling pressure last week as it broke below its 50-day moving average. NYAD had been hanging in there fairly well, but did not confirm the recent highs on the major indexes delivering a negative divergence. Unless this break below the 50-day is repaired soon, we’ll have to see what happens at the 200-day.
The Nasdaq 100 Index (NDX) is in correction mode. The first major support is the 20-day moving average. ADI and OBV have turned short-term negative.
The S&P 500 (SPX) is also in short term reversal mode. Both ADI and OBV have turned negative as sellers make a comeback.
VIX Is Likely to Bounce
After its recent new lows, the CBOE Volatility Index (VIX) is poised to rise as the Russian developments proceed.
When the VIX rises, stocks tend to fall, as rising put volume is a sign that market makers are selling stock index futures to hedge their put sales to the public. A fall in VIX is bullish, as it means less put option buying, and it eventually leads to call buying, which causes market makers to hedge by buying stock index futures. This raises the odds of higher stock prices.
Liquidity May Improve in the Short Term Due to Russian Events
With the Fed on hold, the market’s liquidity has been moving sideways, which is a positive. In the short-term, we may see an improvement, with traders moving to short-term trading instruments as the Russian situation develops.
The Eurodollar Index (XED) has been rangebound. A move below 94 would be very bearish. A move above 95 will be a bullish development. Usually, a stable or rising XED is very bullish for stocks.
To get the latest information on options trading, check out Options Trading for Dummies, now in its 4th Edition—Get Your Copy Now! Now also available in Audible audiobook format!
#1 New Release on Options Trading!
Good news! I’ve made my NYAD-Complexity – Chaos chart (featured on my YD5 videos) and a few other favorites public. You can find them here.
Joe Duarte
In The Money Options
Joe Duarte is a former money manager, an active trader, and a widely recognized independent stock market analyst since 1987. He is author of eight investment books, including the best-selling Trading Options for Dummies, rated a TOP Options Book for 2018 by Benzinga.com and now in its third edition, plus The Everything Investing in Your 20s and 30s Book and six other trading books.
The Everything Investing in Your 20s and 30s Book is available at Amazon and Barnes and Noble. It has also been recommended as a Washington Post Color of Money Book of the Month.
To receive Joe’s exclusive stock, option and ETF recommendations, in your mailbox every week visit https://joeduarteinthemoneyoptions.com/secure/order_email.asp.

